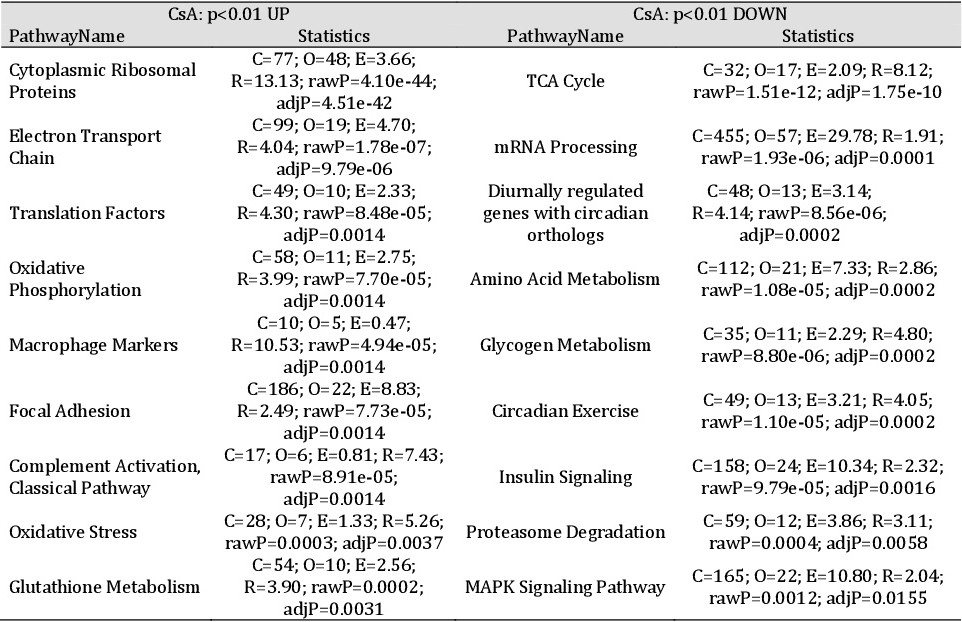
Table 1. Pathways regulated in kidneys of mice following CsA treatment for one week (daily 60 mg/kg BW). Candidate genes that were either up- or down-regulated were selected from microarray data by significant regulation (p<0.01). Enriched pathways (up-regulated: left side; down-regulated: right side) were obtained based on the Gene Ontology, KEGG Pathway, and WikiPathways databases at Web-based Gene Set Analysis Toolkit (WebGestalt). C: the number of reference genes in the category, O: the number of genes in the gene set and also in the category, E: the expected number in the category, R: ratio of enrichment, rawP: p-value from hypergeometric test, adjP: p-value adjusted by the multiple test adjustment